
Key Takeaways
- Averaging range data can be used to smooth out unstable readings
- The mean, median, and mode are the three most common averages
- MaxBotix Inc., recommends the use of a median or mode for averaging range data
Finding an average or standard data value can be a useful way to understand the underlying trends of your data. Averages help you look past random fluctuation and see the central trend of a data set. A key distinction to note early is that there are various types of averages. Each average has its own use and gives you a slightly different understanding of the central trend of a data set.
Mean
The arithmetic mean is one of the most popular averages used in the mathematical and statistical fields. The arithmetic mean is often referred to as the mean. There are other means, but for the duration of this article mean will be used to refer to an arithmetic mean. A mean is calculated by adding up all elements of the data set and dividing that value by the number of elements in the dataset. A mean adds everything up and shares it evenly amongst all elements. While the mean is easily understood and calculated, it is not without its flaws. The mean is highly influenced by outlying data.

Example
Consider a fictional company, Sprocket Shop. Sprocket Shop has ten employees. If we want to understand the average annual earnings of of Sprocket Shop employees we could simply calculate the mean to understand how much each employee earns if all income was shared evenly. We add up the cumulative income to see Sprocket Shop employees earn a total of $1,000,000 a year. We then divide that sum between the ten employees to see an average wage of $100,000.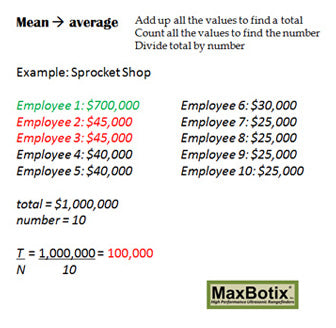
Median
The median is another popular method of finding an average value. To find the median of a dataset, arrange all the elements from least to greatest and pick the middle value. In a case where there are two middle values, take a mean of the two middle numbers. The median is simply the middle number in your dataset. The median is the point where no more than half the values are larger than the element and no more than half the values are lower than the element. The median is considerably more resistant to outlying data points than the mean. While the median is not affected by outliers, it ignores any spread in the dataset.

Mode
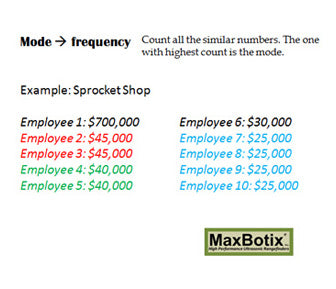
The final of the most common averages is the mode. A mode is the most common reading. Whichever values show up the most is the mode. This average does look for the most popular response. A mode can be very useful in many places. It gives you the most common reading from one of our sensors, or it gives you the most popular response. For example, if you owned a shoe store you want to stock the most popular shoe sizes using the mode shoe size because the most people will request this size. The median or mean sizes will not be nearly as useful to you. However, not every dataset will have a mode. It is also possible to have more than one mode.
When trying to smooth observational data such as that from one of our rangefinders, a median or mode filter can often be superior to a mean filter as they are not affected by an occasional high or low reading. A mean can still be used with observational data, but we do recommend that you consider a truncated mean or a weighted mean to decrease any problems with outliers.
Truncated Mean
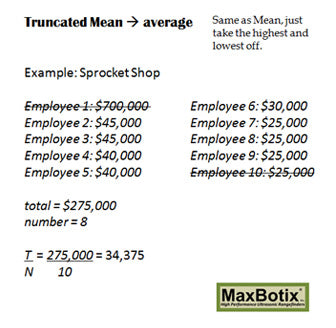
When you list all of the elements of a dataset from least to greatest the outliers will fall at the two extremes. A truncated mean is calculated by taking the mean of the dataset after removing the extreme readings from the two ends. Typically, an even number of readings is removed from each end to prevent skewing the mean toward the high or low end. Truncating the mean removes the effects of outliers from this version of the mean.
Which Average Should You Use
Depending on what you are doing, the appropriate measure of average will change. When averaging data from one of our sensors, MaxBotix Inc., typically recommends a median or mode based average as one bad reading can affect the mean drastically. If you aren't working with a sensor, are you worried about what an even distribution would look like? Then use the mean. Are you wanting to avoid high and low outliers but still get a good idea of the what the middle data points are doing? Use the median. Are you wanting to know the most popular value? Use the mode.
There are other types of averages that are not discussed in this article. Finding the right average for your application does take consideration of your needs, as well as how each average is calculated and exactly what each tells you. If you have questions about data averaging, please contact us. We will be happy to advise you on whether you need to be averaging data and/or how to go about it.